
Fig. 7. a–c: C57BL/6 and CD1-nude mice were injected with AAV9/2-DTPA-R vectors; PET MIPs at 14, 21, and 28 days post-injection showed organ-specific tracer accumulation, with stronger signals in CD1-nude mice. d–e: PET quantification revealed stable expression over time, and dose-dependent uptake in tissues like BAT, liver, heart, and adrenals; control mice showed minimal signal. f: PET / MR overlays enabled precise anatomical localization of DTPA-R expression in transduced organs. g–h: PET signal intensity correlated with both AAV dose and organ perfusion, confirming efficient and perfusion-dependent transduction. i–n: V5-IHC confirmed cellular transduction in the adrenal cortex; PET signal showed strong linear correlation with cell positivity, AAV dose, vector genome levels, and mRNA expression.
PET-based tracking of CAR T cells and viral gene transfer using a cell surface reporter that binds to lanthanide complexes
2025.06.13.
Volker Morath et al, Nature Biomedical Engineering, 2025
Summary
Recent advances in cell and gene therapy highlight the need for effective tools to monitor the in vivo distribution of these therapies. Direct labelling methods, while sensitive, fail to track cell proliferation and viability over time. Optical imaging with reporter genes is limited by poor tissue penetration, whereas PET imaging offers sensitive, quantitative, whole-body tracking. Novel PET reporter system was developed using a surface-expressed anticalin protein that binds a bio-orthogonal fluorine-18 radioligand. This system enables non-invasive, specific, and longitudinal tracking of CAR T cells and AAV-mediated gene transfer in vivo.
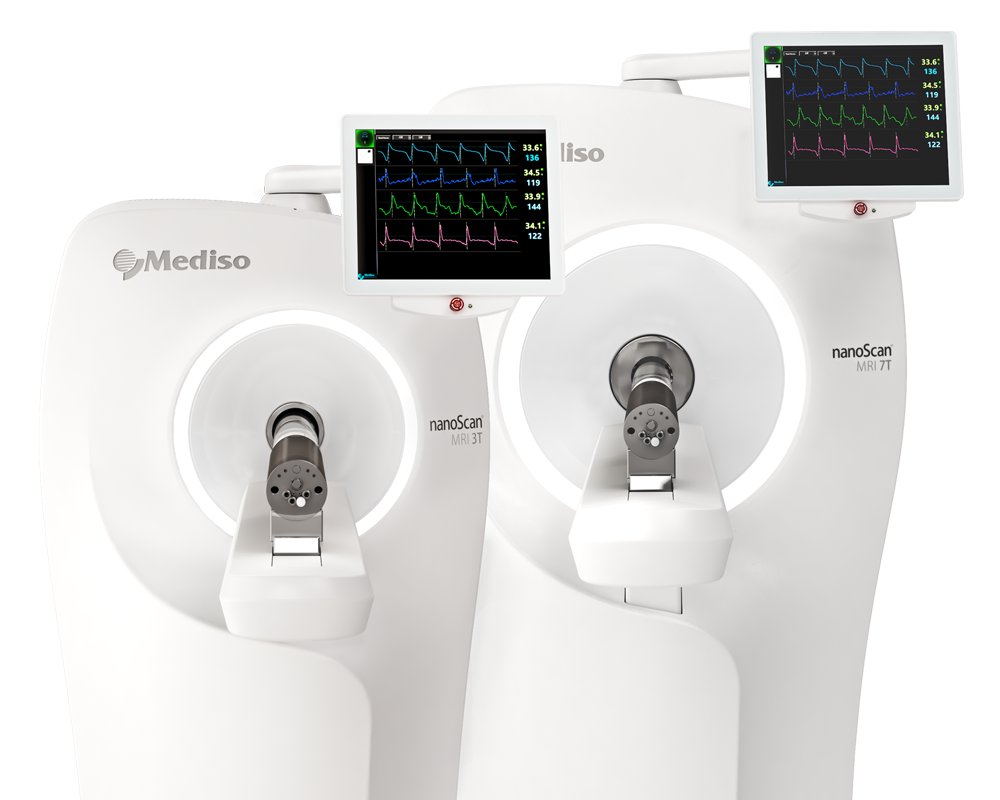
Results from nanoScan PET/MRI 3T®
A compact PET reporter protein (257 aa) made for cell surface expression, enabling specific binding to small-molecule radioligands. Mice were injected with 10–12 MBq [¹⁸F]F-DTPA or [¹⁸F]F-colchicine via tail vein and imaged dynamically for 90 min or statically at 90 min. PET/MR scans were done on a Mediso nanoScan system (3 T, Nucline v3.04), with T1-weighted MR (2D FSE or 3D GRE, 0.25 mm). PET data were reconstructed using Tera-Tomo 3D (0.7 mm resolution).
Dynamic PET imaging of mice bearing xenograft tumours
To validate the reporter gene system, [¹⁸F]F-DTPA was injected into mice bearing PC3DTPA-R and PC3Colchi-R tumours. PET imaging showed rapid renal clearance and strong, specific uptake in PC3DTPA-R tumours, with minimal signal in PC3Colchi-R tumours. The radioligand remained stable in vivo and retained 48% of tumour signal at 6 hours post-injection. Biodistribution analysis showed low background uptake and no sex-specific differences. In contrast, [¹⁸F]F-colchicine had high gastrointestinal excretion and background signal, supporting the superiority of the DTPA-R system (Fig. 3).

Fig. 3. a–d: Dynamic PET scan of CD1-nude mice bearing PC3DTPA-R xenografts on the right shoulder and PC3Colchi-R on the left. The [18F]F-DTPA radioligand accumulates specifically in the PC3DTPA-R tumour, with no uptake in the PC3Colchi-R tumour. Linear and logarithmic time–activity curves show increasing signal-to-background ratio over time. e: Ex vivo biodistribution analysis 90 minutes after [18F]F-DTPA injection, showing organ-specific uptake. f: SEC analysis confirmed that the radioligand remained >97% intact in urine samples.
PET imaging of CAR T cell therapy
PET/MR imaging with [¹⁸F]F-DTPA enabled non-invasive, longitudinal tracking of CAR T cell expansion and infiltration, correlating well with ex vivo flow cytometry and V5-immunohistochemistry. Imaging revealed distinct infiltration patterns and confirmed co-localization of CAR T cells with tumour cells, aligning closely with histological data. Quantitative analysis showed a strong linear correlation between PET signal and CAR T cell numbers in bone. In vitro PET phantom studies demonstrated even higher sensitivity, while in vivo subcutaneous models confirmed reliable detection. Overall, the DTPA-R system allows accurate, sensitive quantification of cell therapies in various tissues (Fig. 5, 6).

Fig. 5. a: Study design: NSG mice were injected with Raji tumour cells, then treated with αCD19-CAR T cells on day 7. PET scans were taken on days 4, 8, 15, 22, and 30 post-treatment. b–c: MIP images show CAR T cell distribution over time in DTPA-R and EGFRt groups; note kidney signals from shed DTPA-R. d: Cumulative PET signal quantification in the upper body and hind legs tracked CAR T cell expansion and decline. e–f: FACS analysis showed absolute numbers of Raji cells and CAR T cells in extremities, spleen, and blood. g–l: PET / MR and IHC imaging revealed patterns of CAR T cell infiltration into bone marrow and vertebrae, with good correlation between PET signal and V5-tag or CD19 staining.
Fig. 6. a–b: After PET imaging, cells from hollow bones were collected and analyzed by flow cytometry; a strong correlation was found between CAR TDTPA-R cell numbers and the PET signal, illustrated with PET / MR cross-sections. c: Individual bone marrow lesions were quantified using PET signal and converted to CAR T cell numbers via the regression line. d: In vitro PET phantom studies showed a linear relationship between [18F]F-DTPA-labelled JurkatDTPA-R cells and PET signal. e–f: Subcutaneous spot assays confirmed PET detection sensitivity down to a few thousand injected DTPA-R-expressing cells, showing clear signal localization in PET scans.
PET imaging of gene transfer mediated by AAV9 viral vectors
Systemic injection of AAV9 vectors encoding the DTPA-R reporter gene enabled PET imaging of gene expression in both immunocompetent and immunocompromised mice, with CD1-nude mice showing higher heart transduction. Repeated PET scans over 28 days confirmed stable expression patterns. Dose-escalation studies revealed a linear correlation between PET signal and AAV dose in several tissues-e.g., liver, adrenalsdemonstrating the method's quantitative power. Tissue perfusion correlated with PET signal slopes, indicating delivery efficiency influences signal intensity. Histology and ddPCR confirmed these findings, showing strong linear correlations between PET signals, transduction levels, and vector genome counts (Fig. 7).

Full article on nature.com
How can we help you?
Don't hesitate to contact us for technical information or to find out more about our products and services.
Get in touch